


There are various formulas for calculating the required sample size based upon whether the data collected is to be of a categorical or quantitative nature (e.g. is to estimate a proportion or a mean). These formulas require knowledge of the variance or proportion in the population and a determination as to the maximum desirable error, as well as the acceptable Type I error risk (e.g., confidence level).
But why bother with these formulas?
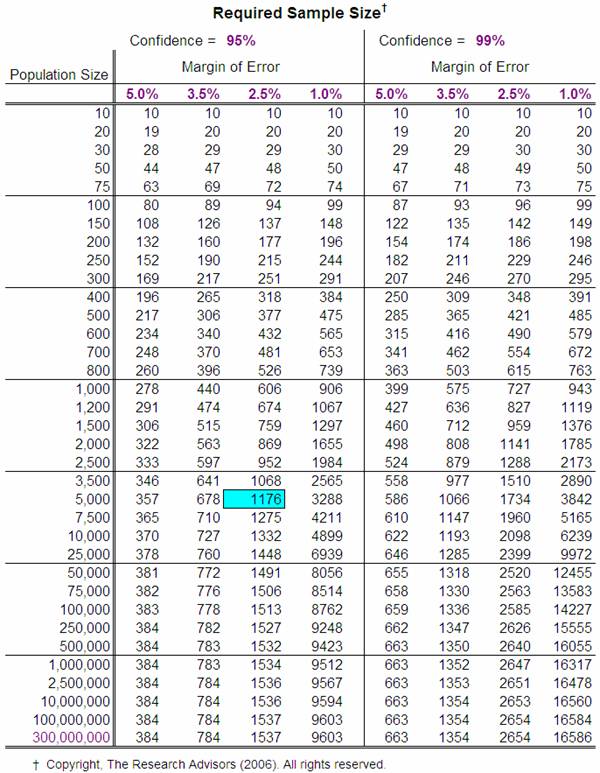
It is possible to use one of them to construct a table that suggests the optimal sample size – given a population size, a specific margin of error, and a desired confidence interval. This can help researchers avoid the formulas altogether. The table below presents the results of one set of these calculations. It may be used to determine the appropriate sample size for almost any study.
Many researchers (and research texts) suggest that the first column within the table should suffice (Confidence Level = 95%, Margin of Error = 5%). To use these values, simply determine the size of the population down the left most column (use the next highest value if your exact population size is not listed). The value in the next column is the sample size that is required to generate a Margin of Error of ± 5% for any population proportion.
However, a 10% interval may be considered unreasonably large. Should more precision be required (i.e., a smaller, more useful Margin of Error) or greater confidence desired (0.01), the other columns of the table should be employed.
Thus, if you have 5000 customers and you want to sample a sufficient number to generate a 95% confidence interval that predicted the proportion who would be repeat customers within plus or minus 2.5%, you would need responses from a (random) sample of 1176 of all your customers.
As you can see, using the table is much simpler than employing a formula.
Professional researchers typically set a sample size level of about 500 to optimally estimate a single population parameter (e.g., the proportion of likely voters who will vote for a particular candidate). This will construct a 95% confidence interval with a Margin of Error of about ±4.4% (for large populations).
Since there is an inverse relationship between sample size and the Margin of Error, smaller sample sizes will yield larger Margins of Error. For example, a sample size of only 100 will construct a 95% confidence interval with a Margin of Error of almost ±13%, too large a range for estimating the true population proportion with any accuracy.
Note that all of the sample estimates discussed present figures for the largest possible sample size for the desired level of confidence. Should the proportion of the sample with the desired characteristic be substantially different than 50%, then the desired level of accuracy can be established with a smaller sample. However, since you can’t know what this percentage is until you actually ask a sample, it is wisest to assume that it will be 50% and use the listed larger sample size.
The number of sub-groups (or “comparison” groups) is another consideration in the determination of a sufficient sample size. Since the parameter must be measured for each sub-group, the size of the sample for each sub-group must be sufficiently large to permit a reasonable (sufficiently narrow) estimation.
Treat each sub-group as a population and then use the table to determine the recommended sample size for each sub-group. Then use a stratified random sampling technique within each sub-group to select the specific individuals to be included.
If you would like to calculate sample sizes for different population sizes, confidence levels, or margins of error, download the Sample Size spreadsheet and change the input values to those desired.
Download the spreadsheet by clicking on the download button:
Note: The spreadsheet was designed for a 17” monitor, so you may have to resize it (“Zoom” it out).
The formula used for these calculations was:
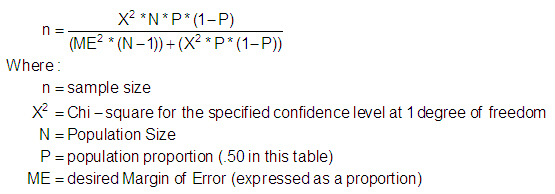
This formula is the one used by Krejcie & Morgan in their 1970 article “Determining Sample Size for Research Activities” (Educational and Psychological Measurement, #30, pp. 607-610).


change "population" to "amount of experiments", and you'll get what u actually wanted to say
![[Lk].Zano](https://steamcdn-a.akamaihd.net/steamcommunity/public/images/avatars/b9/b98e01ce6ef4a5e926a44cdd1564d0e8e5fbfa36_full.jpg "[Lk].Zano")

DOTABUFF
Esports
Heroes
Items
Players
Matches
Blog
Forums
Plus
sano
General Discussion
General Discussion
US servers are the eziest
US SERVERS ARE THE EZIEST IN GENERAL DISCUSSION
Thugger
Thugger an hour ago
Really though. Played With 400ping and several disconection
No farm but still stomped them
http://www.dotabuff.com/matches/2358285721
TripleSteal-
TripleSteal- an hour ago
mom look i won one game this server is the easiest one
Thugger
Thugger an hour ago
Yes just want to share it with my niggas
spunki
spunki an hour ago
There are various formulas for calculating the required sample size based upon whether the data collected is to be of a categorical or quantitative nature (e.g. is to estimate a proportion or a mean). These formulas require knowledge of the variance or proportion in the population and a determination as to the maximum desirable error, as well as the acceptable Type I error risk (e.g., confidence level).
But why bother with these formulas?
It is possible to use one of them to construct a table that suggests the optimal sample size – given a population size, a specific margin of error, and a desired confidence interval. This can help researchers avoid the formulas altogether. The table below presents the results of one set of these calculations. It may be used to determine the appropriate sample size for almost any study.
Many researchers (and research texts) suggest that the first column within the table should suffice (Confidence Level = 95%, Margin of Error = 5%). To use these values, simply determine the size of the population down the left most column (use the next highest value if your exact population size is not listed). The value in the next column is the sample size that is required to generate a Margin of Error of ± 5% for any population proportion.
However, a 10% interval may be considered unreasonably large. Should more precision be required (i.e., a smaller, more useful Margin of Error) or greater confidence desired (0.01), the other columns of the table should be employed.
Thus, if you have 5000 customers and you want to sample a sufficient number to generate a 95% confidence interval that predicted the proportion who would be repeat customers within plus or minus 2.5%, you would need responses from a (random) sample of 1176 of all your customers.
As you can see, using the table is much simpler than employing a formula.
Professional researchers typically set a sample size level of about 500 to optimally estimate a single population parameter (e.g., the proportion of likely voters who will vote for a particular candidate). This will construct a 95% confidence interval with a Margin of Error of about ±4.4% (for large populations).
Since there is an inverse relationship between sample size and the Margin of Error, smaller sample sizes will yield larger Margins of Error. For example, a sample size of only 100 will construct a 95% confidence interval with a Margin of Error of almost ±13%, too large a range for estimating the true population proportion with any accuracy.
Note that all of the sample estimates discussed present figures for the largest possible sample size for the desired level of confidence. Should the proportion of the sample with the desired characteristic be substantially different than 50%, then the desired level of accuracy can be established with a smaller sample. However, since you can’t know what this percentage is until you actually ask a sample, it is wisest to assume that it will be 50% and use the listed larger sample size.
The number of sub-groups (or “comparison” groups) is another consideration in the determination of a sufficient sample size. Since the parameter must be measured for each sub-group, the size of the sample for each sub-group must be sufficiently large to permit a reasonable (sufficiently narrow) estimation.
Treat each sub-group as a population and then use the table to determine the recommended sample size for each sub-group. Then use a stratified random sampling technique within each sub-group to select the specific individuals to be included.
If you would like to calculate sample sizes for different population sizes, confidence levels, or margins of error, download the Sample Size spreadsheet and change the input values to those desired.
Download the spreadsheet by clicking on the download button:
Note: The spreadsheet was designed for a 17” monitor, so you may have to resize it (“Zoom” it out).
The formula used for these calculations was:
This formula is the one used by Krejcie & Morgan in their 1970 article “Determining Sample Size for Research Activities” (Educational and Psychological Measurement, #30, pp. 607-610).
N4tticus
N4tticus an hour ago
N O R M A L S K I L L
Thugger
Thugger an hour ago
Dont spam foolz
aFeect
aFeect an hour ago
^^+1
This comment was edited an hour ago
wooden tree
wooden tree an hour ago
S O R M A L N K I L L
TripleSteal-
TripleSteal- an hour ago
N I G G A S K I L L
spunki
spunki an hour ago
spam? u should actually read this
TripleSteal-
TripleSteal- an hour ago
change "population" to "amount of experiments", and you'll get what u actually wanted to say
spunki
spunki 29 minutes ago
its not a bug, its a feature
a METAPHOR
Thugger
Thugger 21 minutes ago
AAAAAAAAAAAAAAA
U got me confused but
..i.
Maybe I'm on winning spree
[Lk].Zano
[Lk].Zano 18 minutes ago
http://www.dotabuff.com/matches/2246498367
sano
WritePreview
lfmaosmdofafmslfaslfmokasldmf
s;ldmk
Remember to keep your post friendly and within the Dotabuff Code of Conduct
POST COMMENT
English (English)▴
About
FAQ
Support
Privacy
Hiring
Service Status
Help Translate!
Facebook
Twitter
TrackDota
Copyright 2015 Elo Entertainment LLC. Dota 2 is a registered trademark of Valve Corporation.Premium advertising by GameRevolution


Veuillez vous connecter pour publier un commentaire.
Really though. Played With 400ping and several disconection
No farm but still stomped them
http://www.dotabuff.com/matches/2358285721